
What gets measured gets managed. What gets seen gets done. 👀
The best teams don’t bury performance in a spreadsheet nobody opens. They put it on the wall.
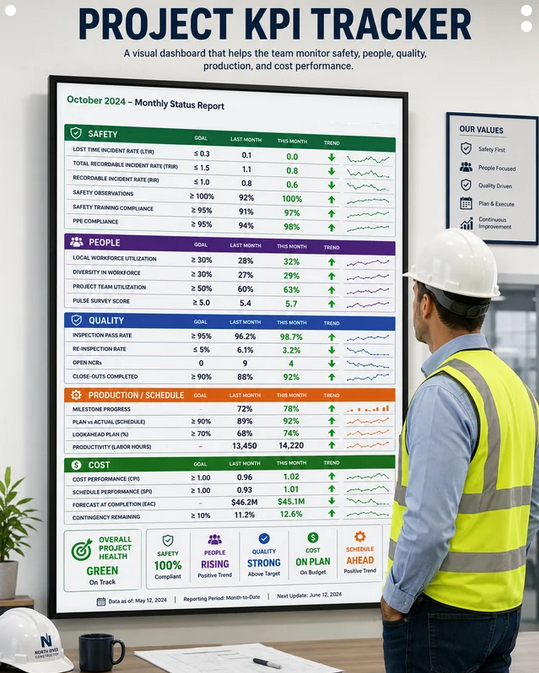
A single visual dashboard — safety, people, quality, production, cost — turns abstract goals into a daily conversation. Red means act. Green means keep pushing. Trends tell you where you’re headed before the numbers catch up.
Here’s why it works:
📈 Trends > snapshots. A single month can lie. The direction of travel tells the truth.
🤝 Visibility builds ownership. When everyone can see the score, everyone plays to win.
🟢 Green isn’t the goal — momentum is. The target is always the same: better than last month.
Stop reporting performance after the fact. Start displaying it in real time — and watch your team rise to meet it.
What’s the one metric your team should be staring at every single day? 👇